
Plattform · Enterprise-Datentransformation und Business Intelligence
Data Factory

Überblick
Enterprise-Datentransformation und Business Intelligence
Business Suite Data Factory verbindet Enterprise-Data-Engineering mit Self-Service-BI für alle Benutzerebenen. Datenteams erstellen robuste ETL-Pipelines und analytische Datenwürfel. Business-Analysten erkunden Daten mit KI-Assistenz. Führungskräfte sehen ihre KPIs in Echtzeit in konfigurierbaren Dashboards. Alles auf einer einheitlichen, sicheren Plattform.
Strategischer Wert
Data without analytical infrastructure is an asset that cannot be monetised. Most enterprises accumulate vast quantities of operational data in their ERP and business systems while simultaneously struggling to answer basic strategic questions: which customers are most profitable, where are we losing margin in the supply chain, which product lines should we invest in, and where are operational costs drifting out of control. Data Factory is the analytical layer that transforms operational data into the intelligence required to run the business strategically. The self-service BI model that Data Factory enables addresses one of the most persistent organisational dysfunctions in enterprise analytics: the bottleneck between business questions and answers. In organisations dependent on centralised BI teams or IT developers to build every report, the time from question to insight can be days or weeks. Meanwhile, the decision has already been made — with insufficient information. Data Factory puts analytical capability directly in the hands of finance analysts, operations managers, and commercial teams, so that insight generation keeps pace with business velocity. The governed semantic layer is the architectural element that separates Data Factory from general-purpose visualisation tools. When KPI definitions — revenue, margin, headcount, on-time delivery — are defined once in a central business glossary and consistently applied across every dashboard and report in the organisation, the problem of conflicting metrics in leadership meetings disappears. There is one number for revenue, one methodology for margin calculation, one definition of active customer. This single source of truth is not a technical feature; it is an organisational capability that changes the quality of executive decision-making. Within Business Suite, Data Factory is uniquely powerful because it operates on live operational data without the latency, cost, and complexity of a separate data warehouse. Executive dashboards reflect the state of the business as of this moment — not as of last night's ETL run. This real-time analytical capability is the foundation for the kind of daily operational management discipline that separates high-performance organisations from those perpetually reacting to last month's data.
Funktionen
Alles, was es kann – sofort einsatzbereit.
Visuelle ETL-Pipeline
Drag-and-Drop-Datenpipeline-Builder mit 50+ Konnektoren, Transformationsoperatoren und Planungsautomatisierung.
Cube-Designer
Visueller OLAP-Cube-Builder mit Dimensions-, Maßnahmen- und Hierarchiedefinition.
Self-Service-Analytics
Drag-and-Drop-Report-Builder mit Pivoting, Drill-Down und Ad-hoc-Abfrage-Unterstützung.
KI-Datenerkundung
Cortex AI ermöglicht natürlichsprachliche Datenbankabfragen und automatisches Erkenntnisprotokoll.
Echtzeit-Dashboards
Konfigurierbare Führungsdashboards mit Live-KPIs, Alerts und mobiler Unterstützung.
Datenqualitäts-Engine
Automatisierte Datenprofilierung, Qualitätsprüfungen und Anomalie-Alerts während der Ingestion.
Datenkatalog
Unternehmensweites Datenwörterbuch mit Herkunftsverfolgung, Eigentümerschaft und Klassifizierung.
Sicherheit auf Zeilenebene
Granulare Datenzugriffssteuerung auf Zeilen- und Spaltenebene basierend auf Business Suite-Benutzerrollen.
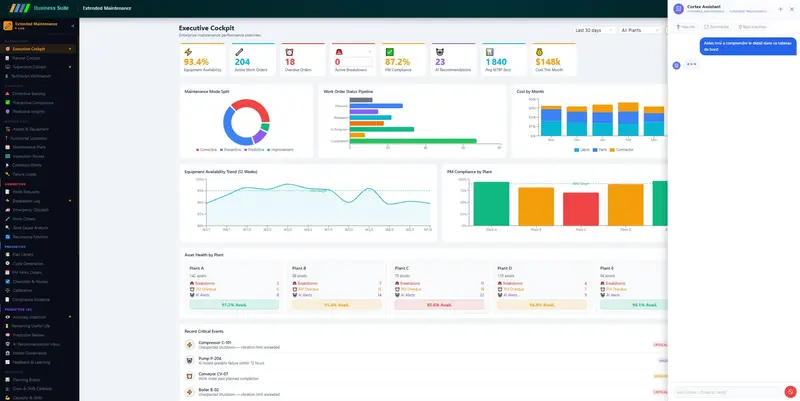
Produkt in Aktion

Spezifikationen
- Datenquellen
- 50+ native Konnektoren + REST/GraphQL
- Speicher
- PostgreSQL, Data Warehouse, OLAP-Cubes
- Visualisierungen
- Recharts + benutzerdefinierte Chart-Engine
- Aktualisierungsrate
- Echtzeit-Streaming + geplante Batches
- KI
- Cortex AI NL-zu-SQL + automatische Erkenntnisse
- Export
- PDF, Excel, PNG, API-Endpunkte
Anwendungsfälle
Wo es Wert schafft.
- 01Unternehmensweite KPI-Dashboards für das Management
- 02Vertriebs- und Marketing-Performance-Analysen
- 03Finanzplanung und -analyse (FP&A)
- 04Operative Berichte über mehrere Datensysteme
- 05Regulatorische Berichterstattung und Compliance-Analysen
Vorteile
- DatendemokratisierungSelf-Service-BI gibt Business-Teams Datenzugang ohne IT-Abhängigkeit.
- 10x mehr Datennutzer
- Report-GeschwindigkeitVisuelle Dashboards ersetzen manuelle Excel-Berichterstattung.
- 80% weniger Berichtszeit
- DatenqualitätAutomatisierte Qualitätsprüfungen stellen die Zuverlässigkeit der Analysen sicher.
- 99% Datengenauigkeit
Integriert mit
Verbunden mit Ihrem gesamten Unternehmen.
- Business Suite ERP
- Cortex AI
- External Databases
- REST APIs
- Data Lakes


BC Skills Group
Sehen Sie dieses Modul mit Ihren Daten.
Erzählen Sie uns von Ihren Zielen. Ein Senior-Berater antwortet innerhalb eines Werktags mit einer ersten Einschätzung – unverbindlich.